Just past the halfway point of the season for the New Jersey Devils, let’s take a look at expected goals and how this team has been faring.
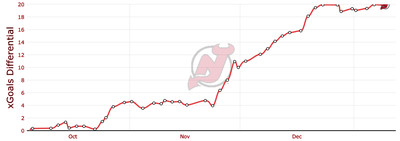
Tonight, the New Jersey Devils will play their 45th game of the regular season. They are still a couple of games ahead of most of the rest of the league and have been since they played their first two games against Buffalo over in Czechia before the season properly started. Most of the league is about halfway through their games this season. Given we are at around the halfway point, I thought it would be prudent to just note and comment on how this team has performed so far this year in terms of expected goals. MoneyPuck has a nice graph showing us the team’s total expected goal differential as the season continues. The more the graph is rising, the better the team is playing at that. The more the graph is flatlining, or worse, going down, the worse the team is playing at that time. Take a look at the Devils’ graph at this point:

Each of those points on the graph is a game that, of course, alters the chart. If the team played well, the graph should rise. If they played poorly, it should flatline or even fall. Over time, this chart tells us when the Devils played well this season, and when they were really just treading water. Of course, expected goals is not the perfect end-all-be-all statistic, but it is a pretty good indicator of how a team is playing, so we can get a general idea from this chart.
As you can see, it took the team a little while to get its legs. It took until the 10th game of the season for them to really figure things out and start playing better hockey. Through 9 games, they were basically treading water in terms of expected goals each game. Then, for the rest of October, the team played well at 5 on 5, bumping their expected goals from +0.25 all the way to +4.62 on November 1. That was a span of 5 games where the team only went 2-2-1 but had some really strong performances and it paved the way for success entering November.
Then, for the majority of November, the team once again flatlined when it came to expected goals. Each game was largely flat, and by November 23rd, they had dropped slightly to +3.92 expected goals on the season. Then, for the last week of November, the Devils went on an absolute tear at 5 on 5, raising their expected goals in this scenario from +3.92 all the way to +10.96 on November 29th. They dropped slightly the next day in the second game of a back-to-back, but still ended November with a +10.02 expected goal differential, a great number.
December was, perhaps, the best month of Devils hockey at 5 on 5, at least in terms of expected goals. For the majority of the month, the team just kept slowly rising on the chart, consistently outperforming their opponents night in and night out. From November 30th through the holiday break, the Devils rose from +10.02 expected goals to +19.93 across 11 games of action. And in each game, they improved their number on this chart. Some games were better than others, but it was a very strong stretch for the team where they went 7-3-1.
Since the team has come out of the holiday break, however, they have looked stale and have really struggled to find the spark that they had before Christmas. It doesn’t only show with the eye test, but it shows on this chart as well. Over the last 7 games, where they have gone 2-4-1 and have lost to some truly bad teams, their expected goals has flatlined. It was +19.93 on Christmas, and today, after the bad overtime loss on Thursday, they sit at +19.87. Not a great trend, and it shows that this team has been in a little bit of a funk recently. It isn’t catastrophic, far from it. They are not falling apart, they are just hitting a little bit of a wall. The trend from this chart suggests that they have all the ability in the world to break through it and continue climbing. They’ve done it more than once already this season, and I have faith they will figure it out this time too.